
Ever found yourself wandering the PostgreSQL pivot labyrinth? It’s a common data maze, but worry not – we’re here to guide you through.
Picture this: PostgreSQL pivot may be like a maze you navigate blindfolded. But here’s the scoop – you’re not alone. We’ve got some PostgreSQL ninja moves up our sleeves.
Pivoting data in PostgreSQL is an art, and we’re about to turn you into a data Picasso. Sometimes pivoting feels like trying to solve a Rubik’s Cube in the dark. But hey, we’re here to flip on the lights and show you three easy ways to pivot like a pro.
But hold on, we’re not sending you on a mad scientist experiment. The expert ways you’ll learn here will make pivoting a walk in the park. No more maze, just smooth sailing through your data.
Here’s the map to our journey:
- Why Pivot Your Data in PostgreSQL
- The Basics of PostgreSQL Pivot Tables
- The 3 Expert Ways with Examples
- Technique #1: Use CASE WHEN
- Technique #2: Use CROSSTAB From the TableFunc Module
- Technique #3: Use a PostgreSQL GUI Tool
- Overcoming Challenges in PostgreSQL Pivot Tables
Ready to dive into the basics of PostgreSQL pivot tables? Buckle up; it’s about to get exciting. Let’s untangle this web and make your data dance to your tune.
Why Pivot Your Data in PostgreSQL
Wondering why bother with PostgreSQL pivot? It’s not just a tech trick – it’s your data superhero cape.
But first, what’s pivoting? It’s like transforming your data, turning rows into columns effortlessly. See a sample below:
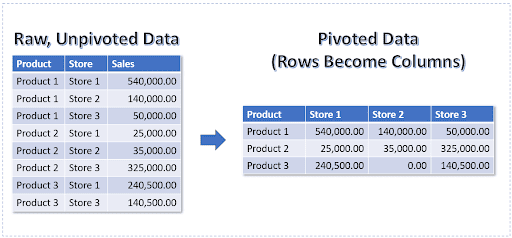
Imagine you’ve got sales data – Pivoting helps analyze it by product, year, and location. It’s like your go-to guy for comparative and chronological analysis of small to massive datasets.
Now, here’s the real talk – the pain points. Did we mention that it feels like a Rubik’s Cube challenge sometimes?
But hey, we’re not leaving you stranded. There are easy ways to do it as you will see later.
Think of it like sculpting – molding your data for clearer insights and powerful analytics. So, why pivot in PostgreSQL? Because it’s not just a move; it’s a game-changer in analytics.
Stay tuned – the next stop is the basics of pivoting in PostgreSQL.
The Basics of PostgreSQL Pivot Tables
In PostgreSQL, pivot basics aren’t about built-in syntax – it’s more like a DIY adventure. This is not like in SQL Server or Oracle. There’s no PIVOT keyword in PostgreSQL.
So, you need to give PostgreSQL what it wants. Then, it will give you your pivot table.
In each of the techniques we will discuss, the following are common stuff you need to provide:
- Row data or names – In a sales report, this could be the product names. Or in an employee performance report, this could be the employee’s name.
- Column data – This is a series of columns that will provide categories or attributes for the Row data. For example, in a sales report, this can be the sales year, quarter, or month. It can also be the store branches, cities, or regions where the business operates.
- Values – this quantifies each row of data. Mostly, it’s a number, like a sales total for a product. But it can also be a text value in some cases, like “Meets Expectations”.
Next up – the part you are all waiting for – the techniques with code samples and screenshots.
The 3 Expert Ways with Examples
The examples we’ll have will use real tables with data. Here’s our simple sales database of a fictitious food chain called Korean Food Stop.
CREATE DATABASE korean_food_stop;
CREATE TABLE products
( product_id SERIAL NOT NULL PRIMARY KEY,
product_name CHARACTER VARYING(15) NOT NULL,
price DECIMAL(5,2));
CREATE TABLE stores
(store_id SERIAL NOT NULL PRIMARY KEY,
store_name CHARACTER VARYING(15) NOT NULL);
CREATE TABLE sales_header
(sales_header_id SERIAL NOT NULL PRIMARY KEY,
sales_date DATE NOT NULL,
or_number CHARACTER VARYING(5) NOT NULL,
store_id INT NOT NULL,
CONSTRAINT fk_sales_header_store_id
FOREIGN KEY(store_id) REFERENCES stores(store_id));
CREATE TABLE sales_detail
(sales_detail_id SERIAL NOT NULL PRIMARY KEY,
sales_header_id INT NOT NULL,
product_id INT NOT NULL,
quantity INT2 NOT NULL,
price DECIMAL(8,2) NOT NULL,
CONSTRAINT fk_sales_detail_sales_header_id
FOREIGN KEY(sales_header_id) REFERENCES sales_header(sales_header_id),
CONSTRAINT fk_sales_detail_product_id
FOREIGN KEY(product_id) REFERENCES products(product_id));
This is nothing without data. So, I used dbForge Studio’s Data Generator to fill the tables.
We will use this database with most of the examples later.
So, buckle up, because code’s coming to clear the clouds of pivot confusion.
Technique #1: Use CASE WHEN
First, the classic move – using the CASE WHEN technique. It’s like your SQL comfort zone. No need for extra syntax lessons – this works not just in PostgreSQL but in other databases too. Think of MySQL, SQL Server, or Oracle.
Here’s the game plan:
- First, follow the 3 stuff PostgreSQL needs to give you pivots – row data, column data, and values.
- Then, use CASE WHEN to form the column data.
Before we present our pivot example, let me show you the unpivot version first. Here’s the code:
SELECT
sh.sales_date
,p.product_name
,s.store_name
,sd.quantity
,sd.price
FROM sales_header sh
INNER JOIN sales_detail sd ON sh.sales_header_id = sd.sales_header_id
INNER JOIN products p ON sd.product_id = p.product_id
INNER JOIN stores s ON sh.store_id = s.store_id;
The above will show the sales for each day. It will give you the food product and its price. This is a very detailed version of sales data.
Now, check out the first 20 rows of sample output:
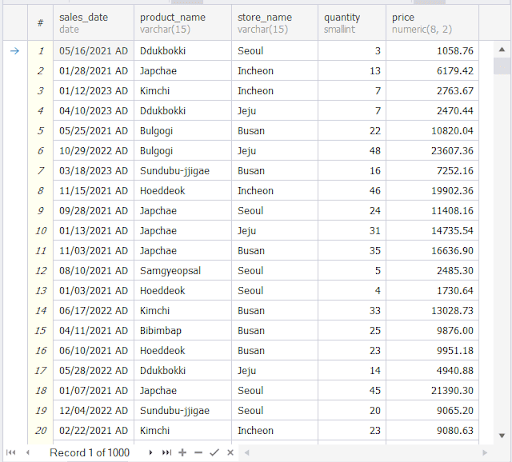
These are individual transactions per date. Notice the stores are rows. In the pivot version, we’re going to summarize the sales per product. Then, show the sales per store. And stores will become columns.
The Pivot Table Query Using CASE WHEN
Now, behold our killer CASE WHEN example:
SELECT
p.product_name,
SUM(CASE
WHEN s.store_name = ‘Jeju’ THEN sd.price ELSE 0
END) AS “Jeju”,
SUM(CASE
WHEN s.store_name = ‘Daegu’ THEN sd.price ELSE 0
END) AS “Daegu”,
SUM(CASE
WHEN s.store_name = ‘Seoul’ THEN sd.price ELSE 0
END) AS “Seoul”,
SUM(CASE
WHEN s.store_name = ‘Busan’ THEN sd.price ELSE 0
END) AS “Busan”,
SUM(CASE
WHEN s.store_name = ‘Incheon’ THEN sd.price ELSE 0
END) AS “Incheon”,
SUM(sd.price) AS Total
FROM sales_header sh
INNER JOIN sales_detail sd ON sh.sales_header_id = sd.sales_header_id
INNER JOIN products p ON sd.product_id = p.product_id
INNER JOIN stores s ON sh.store_id = s.store_id
WHERE sh.sales_date BETWEEN ‘2023-01-01’ AND ‘2023-12-13’
GROUP BY p.product_name;
We used the CASE WHEN condition to form the pivot columns. The product name is our row data. Then, the sales figures for a store in a Korean city selling the product form the column data. Then, we added an extra column to sum the sales per product for all stores.
Here’s the pivot table output:
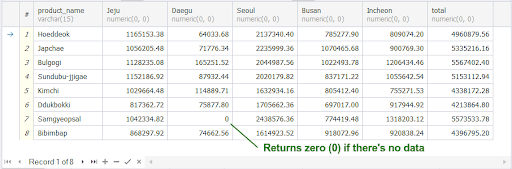
Notice the arrangement of the CASE WHEN determines the column arrangement too. And because the CASE WHEN has an ELSE block, it handles the NULLs and replaces them with zero. All 8 products and 5 stores appeared in the results which is correct.
Pros and Cons of This Technique
Pros:
Familiar syntax. No need to learn extra syntax to pivot data.
No need to install or buy an external module or tool.
You can add extra columns like grand totals or the like.
Cons:
The columns are fixed. Whether a store is added or closed down, you will change the code.
Transposing it differently requires changing the code too. For example, if you want to make the products as columns and the stores as rows.
Technique #2: Use CROSSTAB From the TableFunc Module
Now, let’s dive into the second move in our PostgreSQL pivot dance – the CROSSTAB function.
This technique requires the TableFunc module, but installing it is as easy as pie. Just run:
CREATE EXTENSION IF NOT EXISTS tablefunc;
This technique has this game plan:
- First, follow the 3 stuff PostgreSQL needs to give you pivots – row data, column data, and values.
- Then, a SELECT statement with the output you want to pivot. This is the first parameter value for the CROSSTAB function.
- Then, provide a list of pivot columns. This is the second parameter value for the CROSSTAB function.
- And then, the outer SELECT statement querying the results of CROSSTAB.
- Finally, a list of output columns. It’s best to have the column names here the same as the result of the list of columns in the second parameter.
The Pivot Table Query Using CROSSTAB
You already have an idea of the raw data from the first technique. So, here’s the code using the CROSSTAB function:
SELECT * FROM crosstab(
$$SELECT
p.product_name,
s.store_name,
sum(sd.price) AS sales
FROM sales_header sh
INNER JOIN sales_detail sd ON sh.sales_header_id = sd.sales_header_id
INNER JOIN products p ON sd.product_id = p.product_id
INNER JOIN stores s ON sh.store_id = s.store_id
WHERE sh.sales_date BETWEEN ‘2023-01-01’ AND ‘2023-12-13’
GROUP BY p.product_name, s.store_name
ORDER BY p.product_name, s.store_name$$,
$$SELECT store_name FROM stores ORDER BY 1$$
) AS ct(product varchar(15), busan decimal(15,2), daegu decimal(15,2),
incheon decimal(15,2), jeju decimal(15,2), seoul decimal(15,2));
Observe the following from the above statement:
- The 2 SELECT statements are string values enclosed with $$ and separated by a comma.
- The first SELECT statement follows the rules of providing the 3 columns – row data, column data, and values.
- The second SELECT statement is also a query of all stores.
- The sort order of the stores in the first and second SELECT should be the same. Both are in ascending order in our sample code.
- The output figures should be the same as the first technique.
- The final part is the list of output columns and their types. Note that you need to arrange these based on the order of the result of the second parameter. Or the result will make you nuts. There are no runtime errors, but the result is not correct.
The only difference between the result of this technique and the first one is the arrangement of pivot columns. The first one uses the arrangement of the CASE WHEN while this one uses an ordered list.
Note that there are two other CROSSTAB syntax variants. But the one we used here is much better because it already handles nulls.
Here’s the output of this method:
Pros and Cons of This Technique
Pros:
The code is shorter.
Handles NULLs without extra code.
Cons:
Needs installation of the tablefunc module (though this was easy).
Columns are still fixed. Needs changes to the code when you want a different pivot table of the same data.
Technique #3: Use a PostgreSQL GUI Tool
Now, let’s explore the third and perhaps the most user-friendly move in our PostgreSQL pivot repertoire – leveraging a PostgreSQL GUI tool.
Picture this – you’re not just navigating code; you’re orchestrating your data symphony with the ease of a conductor. Our tool of choice? dbForge Studio for PostgreSQL.
Using a GUI tool is like turning your pivot journey into a visual feast, reminiscent of creating pivot tables in Excel.
Here’s a sneak peek at how to wield the power of dbForge Studio:
- From the main menu, click Database, then select Pivot Table.
- Drag your table from the Database Explorer or write your SQL statement.
- Drag columns for pivot row data, column data, and values.
- Add a filter for precision (optional).
- Play with the output format to uncover deeper insights.
No coding stress – just drag, drop, and pivot like a pro. The beauty? No worrying about fixed columns.
And hey, we’ve got your back with images showcasing different pivot tables. Let your data creativity run wild! Check it out below.
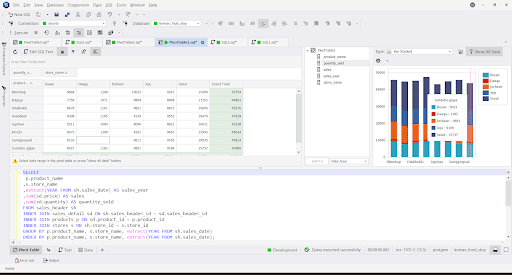
Example 1: Using a Written Query and a Pivot Table with Collapsible Columns
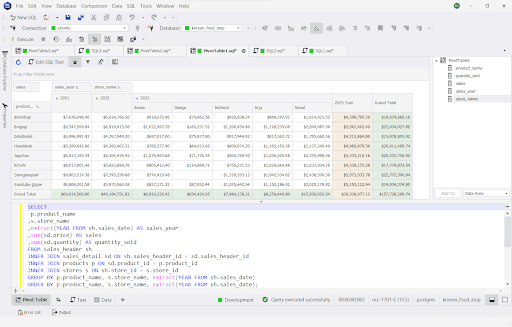
What do we have from this screenshot?
- The query is just below the pivot table, and it shows a sales report. You can either paste the code here are craft it out from the same place.
- The years are collapsible so you can see a summary per year. Then, it’s expandable so you can see the store locations and their sales.
- It also has a total per product per year and a grand total at the end.
Example 2: Using a Pivot Chart
This part is the one you can never do with SQL only. The chart can be a bar, pie, line, or more. The basis of the pivot table and chart is the product and the store locations.
Example 3: With a Filter and a Collapsible/Expandable Date Column
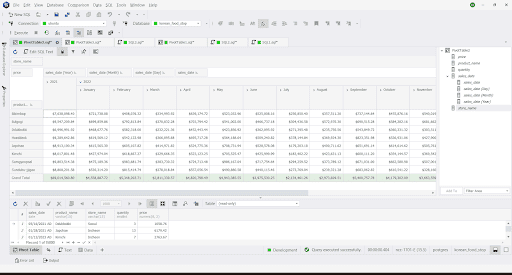
The above screenshot shows advanced date-wised sales reporting where you can expand up to a specific date. You can still summarize by year or month.
Example 4: Employee KPI Sample
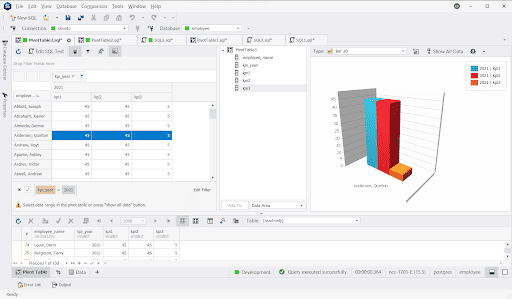
You can create a table of employees with Key Performance Indicators (KPI) with different criteria and achieve the result as the above.
Pros and Cons of This Technique
Pros:
Flexible drag-and-drop approach. No more fixed columns to deal with.
NULLs are also handled nicely.
Cons:
For numeric data values at the moment
Overcoming Challenges in PostgreSQL Pivot Tables
Pivoting isn’t always a smooth ride. Challenges lurk, but fear not – we’ve got your troubleshooting guide.
Common hurdles? NULL values, slow performance, and debugging quirks. Like any adventure, expect some twists.
Debugging Technique: Isolate and Fix
Using CASE WHEN: If NULL values haunt you, isolate portions and fix with a CASE WHEN condition. Example:
SUM(CASE WHEN s.store_name = ‘Jeju’ THEN sd.price ELSE 0.00 END) AS “Jeju”,
The zero fallback in the ELSE block tackles those sneaky NULLs.
Using CROSSTAB: Isolate code portions and run separately to fix syntax and semantic errors. Using the example earlier, run the 2 SELECT statements separately. Then, fix them accordingly.
Using GUI Tools: Ensure the correct table or SELECT statement input. Tackle problems head-on.
Performance Woes? Optimize Your SELECT Statement
Use EXPLAIN: Peek into the execution plan, spot problems like missing indexes, and fix them. Example:
EXPLAIN SELECT * FROM your_table WHERE your_conditions;
dbForge Studio Query Profiler: Visual analysis of execution plans, query cost, and more. Identify bottlenecks.
Here’s an example of execution plan comparison before and after indexing of the sales_header and sales_detail tables.
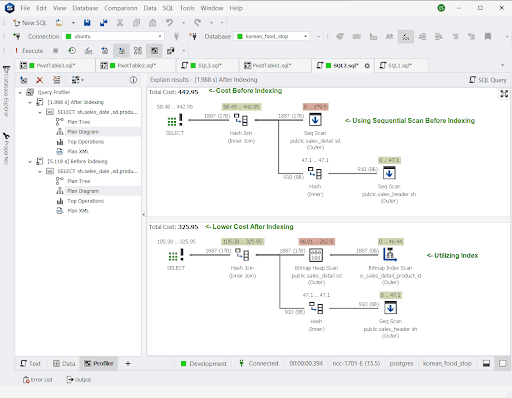
It shows that the absence of indexes has a higher query cost and so, is slower. The execution time also proves this.
The point? Design your database and craft your queries with performance in mind, so, your pivot tables will run faster.
Takeaways
In the whirlwind of PostgreSQL pivot possibilities, here are your key takeaways – your roadmap to becoming a pivot pro.
We’ve explored the twists and turns of PostgreSQL pivot, transforming data like seasoned wizards.
From CASE WHEN syntax to CROSSTAB magic and the user-friendly GUI journey, you’re armed with three potent techniques.
Now, it’s your turn to shine. Dive into the PostgreSQL pivot playground and experiment with the techniques.
Imagine the satisfaction of pivoting with finesse. Then turn complex data scenarios into clear insights.
In the ever-evolving world of tech, having a trusty guide matter. Bookmark this article for those “Aha!” moments and quick references.
Feeling the GUI magic? Take dbForge Studio for PostgreSQL for a spin. Elevate your PostgreSQL coding game and experience productivity like never before.
With drag-and-drop simplicity, you’ll pivot through your data with less effort. In the end, you gain insights and make informed decisions.
The PostgreSQL pivot journey is both an art and a skill. Embrace the challenges, celebrate the victories, and keep honing your pivot prowess.
This article is your companion, your guide through the maze. Pivot like a pro, and may your data adventures be nothing short of legendary!