Understanding the actions of your functions is a better way to monitor serverless apps.
Although many advanced tools are available to track the performance of traditional applications, serverless computing is still gaining ground. You need a tool that is specifically designed for a serverless architecture. These tools integrate tightly with the serverless runtime environment to collect critical data for better visibility and debugging.
They help you prepare your application quickly and confidently. If you are new to serverless, you can read this introductory article or consider enrolling in an online course.
Ready for all the explore?
Following are the Tools to Monitor and Debug Serverless Applications;
1) IOpipe
The first on the list of Tools to Monitor and Debug Serverless Applications is IOpipe. Everything is available in IOpipe, including alerting, real-time analytics, error aggregation, profiling, and tracing.
Explore the full picture of what your AWS lambda functions are doing and get alerts when something goes wrong via email, webhooks, slack, and pager duty. You can drill down to the exact application and see the metrics in great resolution.

IOpipie has robust tracing to monitor function calls and notify users when performance is affected. After release, this can be useful for troubleshooting performance-related issues. Let’s examine a few attributes.
- Powerful and quick data tracing search.
- Weekly email updates on the most common bugs, notifications, and performance enhancements.
- Application Tagging
- Use CPU profiling to troubleshoot Node.js for excessive CPU usage.
For a serverless application, IOpipe is DevOps. You can track up to a million function calls per month using their free plan.
2) Splunk
Azure Functions, Google Cloud Functions, and AWS Lambda can all be monitored using Splunk. Real-time performance tracking and visibility for your applications.
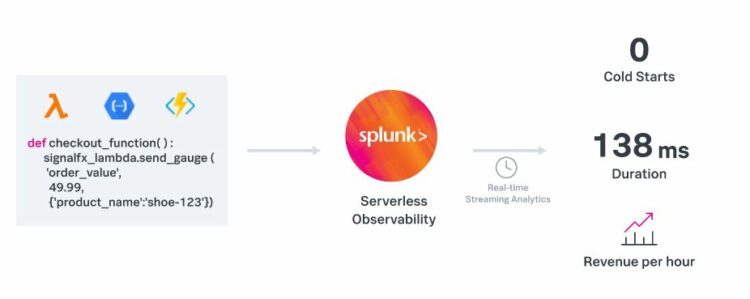
Among the attributes are:
- Low latency measurement
- Aggregation and visibility in real-time
- Monitoring memory usage and execution time
- Cold detection begins.
- Cost optimization
3) Amazon CloudWatch
CloudWatch collects basic lambda metrics by default. On the other hand, you can choose to enable custom metrics. You can start using it for free and pay as you go, as there is no commitment or upfront cost.
You can aggregate all your AWS data into one platform with CloudWatch, giving you complete resource visibility.
4) Epsagon
Epsagon uses AI algorithms combined with distributed tracing technology to automatically identify all transactions within an organization’s systems, provide information about the cost and efficiency of business processes, and provide customers with potential. Be aware of problems before they arise.
Epsagon does not require user code modification because it uses automated tools.
5) Dev Tools
Developer tools for serverless platforms and applications are part of the open-source SLS-dev-tools project, also known as Serverless Development Tools. It is built by London-based software startup Theodo. Their serverless approach combined with cloud-native architecture allows for faster and more creative thinking.
The arrow keys on this tool are used for navigation, while the tab key is used to transition between panes. To check the summary statistics of a function, select any lambda function and press Enter.
They work on a pay-per-use basis, so periods when your application is not in use are free.
An improved version of this utility is available at SLS-dev-tools Guardian. With a serverless architecture, this program automates the best audit techniques. This helps to detect problems early so that they can be prevented from occurring.
6) SenseDeep
One of the fastest serverless monitoring systems available for AWS is SenseDeep. It can help you with real-time service troubleshooting.
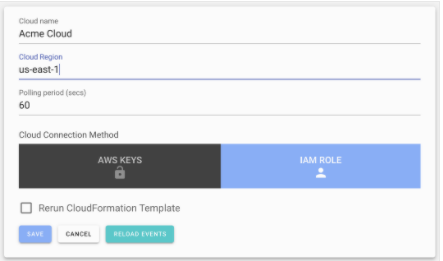
After you log in, SenseDeep will automatically generate some log reports, which you can open to view details. To view serverless features and logs, you must link the SenseDeep cloud to your AWS account. To connect to AWS, you can use the IAM Roles option or AWS Access Keys.
SenseDeep’s auto-discovery feature will search for log groups and lambda functions displayed on the home screen after a successful connection.
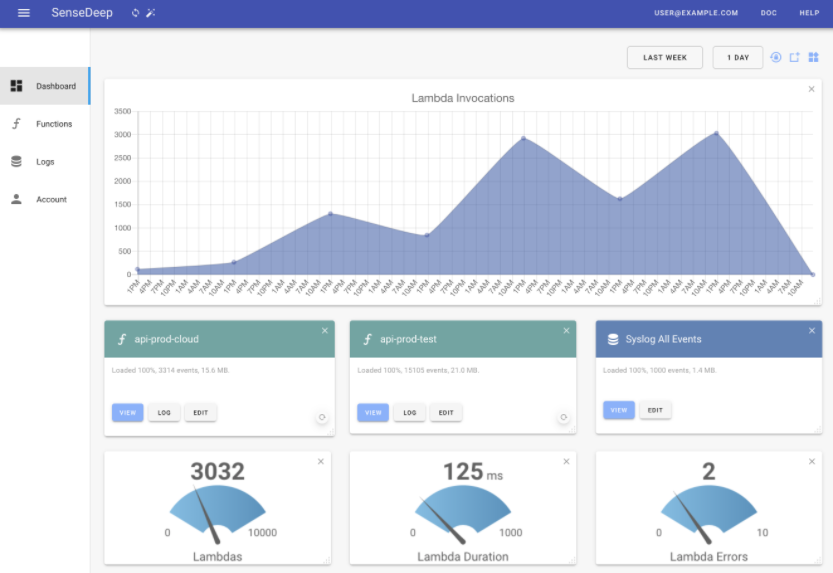
SenseDeep’s dashboard, as shown above, is highly customizable. In the dashboard, you have the option to select which widget to display and even resize it. Team members can also access and share this dashboard.
Other functions that SenseDeep provides are listed below:
- Creates and displays metrics for lambda functions.
- Provides a detailed overview of each lambda function.
- Presents a Log Viewer window with search and query scrolling features.
- Easily accessible navigation page with frequently used commands
7) Lumigo
Lumigo allows you to monitor and debug your serverless apps instantly.
This platform allows you to follow the application process from start to finish. By employing real-time monitoring and analysis to comprehend intricate system behavior, it speeds up problem-solving.
All you have to do is connect your environment, set up an account, and configure alerts.
It finds the source of the problem and fixes it in your distributed configuration. Its capabilities to identify application bottlenecks and critical paths help increase performance by reducing latency and increasing efficiency.
By providing you with the best practices, it helps with serverless installations and development tasks. This way, you can find problems and misconfiguration before they affect the production environment.
With Lumigo’s simple application cost structure, you can predict and manage your future costs.
8) Serverless Framework
With a minimal amount of overhead and costs, you can build, deploy and monitor your serverless apps with the help of a Serverless Framework.
You can monitor your application without spending time writing thanks to Serverless Framework Pro. Everything is taken care of!
Simply visit the dashboard to view information about application patterns, error details, application performance, etc.
The information provided is accurate and contains all the information you need to resolve the issue.
The collaboration feature of this platform is really fantastic! Team members can also collaborate with limited access by sharing the dashboard with them.
9) Dashbird
The last in the list of Tools to Monitor and Debug Serverless Applications is Dashbird. For applications based on AWS lambdas, Dashbird is a preferred option. To optimize cost, performance, and resources, it establishes a connection with AWS and offers analytics at the account, service, and function levels. Failures can be detected specifically for Lambda by Dashbird.
For example:
- Timeout
- Memory issue
- Misconfiguration
- Runtime errors
- Exceptions
Email or Slack can be used to receive failure alarm notifications.
Full-text searches of CloudWatch logs are available, and you can perform a live call for troubleshooting.
Advantages:
- Errors from several metrics for simple debugging
- Real-time metrics and system health across the entire account
- Establish monitoring for a critical business function: microservice monitoring.
- Metrics for system performance
- Implementation timeline and application breakdown.
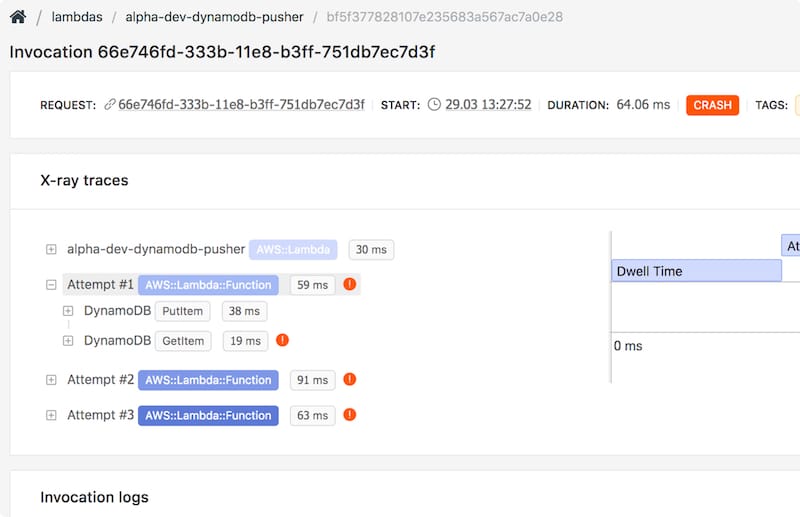
Dashbird integrates with AWS X-Ray to provide you with application information.
It can be started for anything. It is currently compatible with the following languages:
- Java
- Node.js
- Go
- Python
Try it out to discover how Dash Bird works. They have the best documentation.
That’s it for the list of Tools to Monitor and Debug Serverless Applications.
Consider The Following:
- YouTube Thumbnail Preview Tools
- Serverless Databases
- IVR Software
- AI Twitter Tools
- AI Coding Tools For Developers
- Hiperdex
Abstract
With any luck, this has given you some ideas for monitoring and debugging your contemporary application. The best course of action is to try it out and see what works for you, as most of them have a free plan. Once monitored, remember to protect it.