In the event that your business has entered the cloud, you must guarantee resource visibility through cloud visualization.
A thorough understanding of resource configuration and provisioning is essential for cloud systems. Although many businesses solve this problem by hand-drawing architecture diagrams, this is a time-consuming and error-prone procedure.
Teams, however, can quickly avoid the chance of error and spot misconfiguration by using cloud visualization tools.
☁️ Cloud Visualization: What is it?
In simple terms, cloud visualization is the process of using a diagram or chart to display data about the interaction of cloud infrastructure and resources. For enterprises, it streamlines the process of understanding the cloud environment.

Data visualization has gained popularity in big data and cloud computing corporate environments. You can view the constantly shifting cloud environment’s terrain with only a cursory glance.
Reasons for Cloud Infrastructure Visualization
Cloud data visualization is useful for many reasons. These are a few that are worth mentioning.
Defining Detailed Resource Connections
Businesses can draw relationships between existing cloud resources and explore configuration details with cloud visualization. It aids in the comprehension of the elements of the constantly evolving cloud system by both novice and expert users.
Demonstration of Compliance
Mission-critical data is now stored by businesses on various cloud platforms. As a result, it is important to ensure data security and compliance. Cloud visualization tools allow you to verify compliance. Auditing or compliance teams will also benefit from faster audits of your cloud environment.

Acknowledging Changes in Infrastructure
In the era of continuous integration and deployment, teams often upgrade their cloud infrastructure setup. Cloud data visualization tools can help DevOps teams verify whether changes have been made properly, even when the change is difficult to validate.
Identifying Errors
Teams can analyze resource and security-related configurations with dynamic visual diagrams. Users can quickly identify incorrect and redundant fragments and prioritize problem-solving.
Why are Pre-Built Templates not as Good as Automated Cloud Visualization Tools?
Static infrastructure diagrams can be drawn by hand and updated if anything changes. But your outside consultants or engineers will take a lot of time. You save time and money because these tools automatically create and update diagrams.
You should now feel confident in your decision to go with visualization tools instead of the manual approach. Here’s our pick of the best cloud visualization tools:
1) Cloudockit
The first on the list of Cloud Visualization Tools is Cloudockit. Software for better cloud documentation that can automatically create architecture diagrams is called Cloudockit. Cloud service providers, including Kubernetes, Hyper-V, VMware, AWS, Azure, and Google Cloud, are supported.
This tool will easily create editable cloud architecture diagrams. All you have to do is choose the level of detail you want to add to your sketch. This tool maintains accurate and up-to-date information by generating technical documents in Word, Excel, HTML, or PDF format.
It is able to understand any component that is configured in your cloud. As a result, it can easily detect any potential security vulnerabilities or misconfiguration. You save money and energy as the platform automatically tracks all changes in your environment.
Businesses can keep a close eye on their cloud spending with Cloudockit to ensure they don’t go over budget. Exporting data to Excel, PDF, and JSON formats is also supported. The diagrams created here can be used with common diagramming programs such as Diagrams.net, Lucidchart, and Visio.
Eleven separate drop-off sites are supported by this technology for schematic and document storage. As a result, you can get updates whenever it’s best for you. These places include your storage, email, callback URLs, Teams, Microsoft 365, Azure DevOps, OneDrive, SharePoint Online, GitHub, etc.
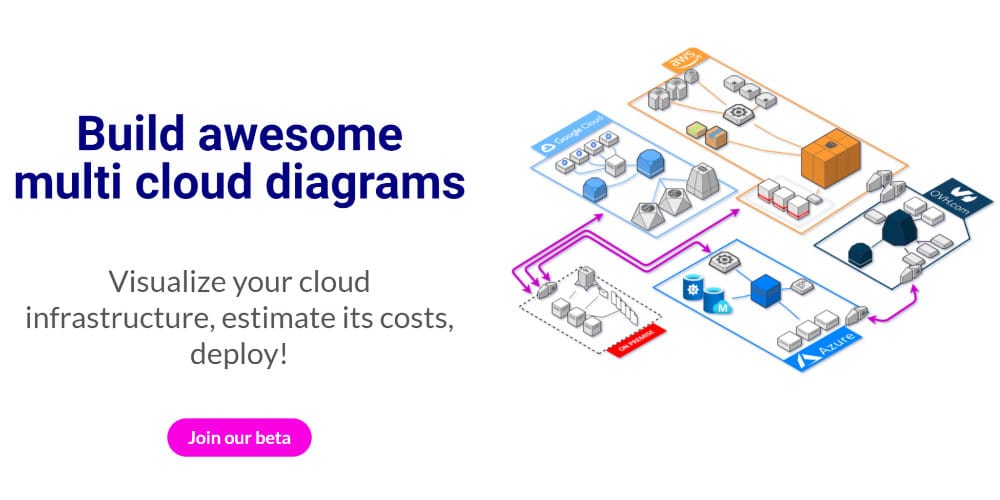
2) Holori
With Holori, you can create multi-cloud diagrams to help with cost optimization and cloud visualization. It uses customizable features, vendor icons, and a template library to visualize your cloud architecture.
It is possible to visualize the entire infrastructure across departments, projects, and geographic regions. You can also use it to find any unused or unknown components, preventing security flaws and unnecessary costs.
Additionally, the platform may notify you when vulnerabilities are detected. Users are able to make annotations directly on text or diagrams and collaborate with their co-workers in real-time. The finished project is easily shared with other teams.
By connecting Holori to their cloud provider, businesses can also export and implement cloud architectures. Additionally, it is possible to export cloud visualization diagrams in JSON, PDF, and PNG formats.
3) CloudSkew
Are you trying to find a cloud visualization tool that minimizes installation hassles? You can get help from CloudSkew. Your diagrams are automatically saved to the cloud storage of this online diagram generator and editor, which also serves as a cloud diagram repository.
It has an integrated document editor that enables you to annotate network diagrams, flowcharts and documents. You don’t need to search for and download separate symbols and icons when creating diagrams.
An unlimited-size canvas is included with this platform. Any sketch you create here is automatically saved to the cloud, where it can be exported, shared, or printed.
Top cloud systems, including AWS, Azure, GCP, Kubernetes, IBM Cloud, Oracle Cloud (OCI), and others, are included in its icon library. Above all, CloudSkew has an easy-to-use interface with a basic design and uncomplicated workflow.
4) Hyperglance
If you’re having trouble understanding the relationships and setup of your complex cloud infrastructure, Hyperglance offers dynamic and user-friendly cloud diagrams to help you. All your cloud inventories, including Kubernetes, AWS, and Azure, are now visible in a single view.
You save time because drawing and updating are automatic. The adaptable HyperGlance platform expands to meet your company’s needs.
Additional capabilities of this cloud visualization platform include the ability to explore extensive metadata, navigate between search results and the cloud platform, check resource dependencies, and overlay metadata on diagrams.
Diagrams can be exported in Visio, CSV, or PNG formats. Even better, users can schedule the export process to a specific storage account or automate it using the REST API.
5) Kumolus
Users can view their cloud services with Kumolus without knowing any code. To dynamically view your existing cloud facility and network topology in real-time, just one click is all it takes. To avoid any security risks, businesses can import their existing deployments with read-only access.
This tool will automatically generate the code as you draw the diagram. As a result, it removes all chances of error and saves you hours of coding work. Stack diagrams for networks and applications are supported on this platform.
Additionally, whether you design a diagram or make changes to it with a native or third-party application, the document is automatically updated. Additionally, you can export your wiki pages and reports with any configuration data.
With Cumulus, you can configure RBAC controls for cloud platform visualization and provisioning across multiple users and teams. Since it maps the cost of any deployed service in real time, you can also use it to calculate the cost of cloud services.
Using its services, you can reduce risk, accelerate deployment, and guarantee accurate configuration deployment.
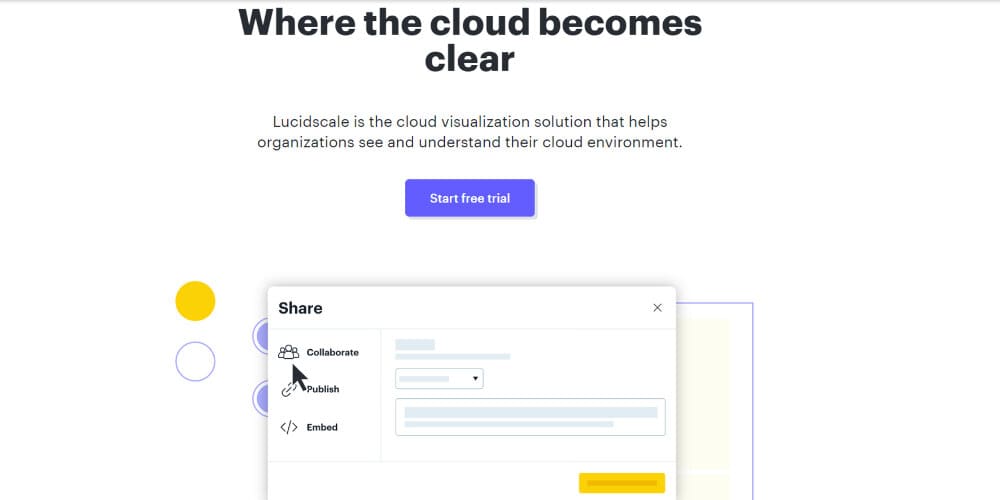
6) Lucidscale
A comprehensive perspective of an organization’s cloud infrastructure can be obtained using Lucidscale, a tool for cloud visualization. It facilitates automated data visualization of systems like AWS, GCP, and Azure, helping you understand how things work.
Organizations can highlight all the important cloud governance data using cloud infrastructure visualization. Detecting unlabeled or orphaned data components also helps you reduce unnecessary costs and reduce risk.
Diagrams showing the differences between the planned structure and the existing infrastructure can be created using this platform. As a result, downtime and security gaps can be avoided.
You can focus on certain elements like virtual machines, VPCs, zones, etc., using Lucidscale’s filters. Wiki pages or confluences can also be used as a central repository for automated cloud documentation. This feature will maintain communication between all team members and external stakeholders.
To improve team productivity and communication, Lucidscale provides dynamic interaction with Confluence, AWS, Google Cloud Platform, and Azure. It also employs the greatest security procedures to guarantee that your data is safe and accessible only to those who are permitted.
Additionally, 256-bit encryption is used by the platform to protect user data while it is in transit and at rest.
7) Cloudcraft
An intelligent cloud visualization tool for AWS diagram visualization is called Cloudcraft. An expert architectural sketch can be created on this platform in minutes. This tool, with its excellent AWS features, makes drawing quick and easy for both new and old projects.
In addition to adding the document directly to your sketches, you and your collaborators can make changes to them online. Additionally, it allows you to export diagrams to wiki pages, documents, and presentations, as well as share them with your team.
It is possible here to understand core services with intelligent components of EC2, ELB, Route 53, Lambda, DynamoDB, RDS, Redshift, and CloudFront. Additionally, an API is offered to filter AWS accounts.
8) Hava
By integrating Hava into your company’s toolkit, you can view both the history and current status of your cloud account in one place. Even if your cloud platforms consist of many complex components, you can easily create cloud diagrams from multiple vendors with the help of this automated application.
Organizations are able to monitor open ports, security, traffic flow, configuration and functionality, among many other things. Hava supports AWS, Azure, and GCP as cloud vendors for logical diagrams that show resources and connectivity.
You can view the properties of each resource, such as connections, subnets, security groups, and incoming and outgoing IP addresses, by selecting it. This feature is very helpful for identifying anomalies and checking business estimates related to expenses and management.
You may avoid the hassle of manually updating the diagram because this cloud visualization tool continuously records changes in real-time and monitors the infrastructure setup. To capture real-time data, businesses can sync and export network diagrams in PNG, PDF, Visio, CSV, and JSON files.
Additionally, organizations can use the data in wikis, reports, and presentations. In addition to these capabilities, Hava makes it easy to version data on-demand, including historical diagrams and snapshots. You can use this information as evidence when presenting your documents to compliance and security auditors.
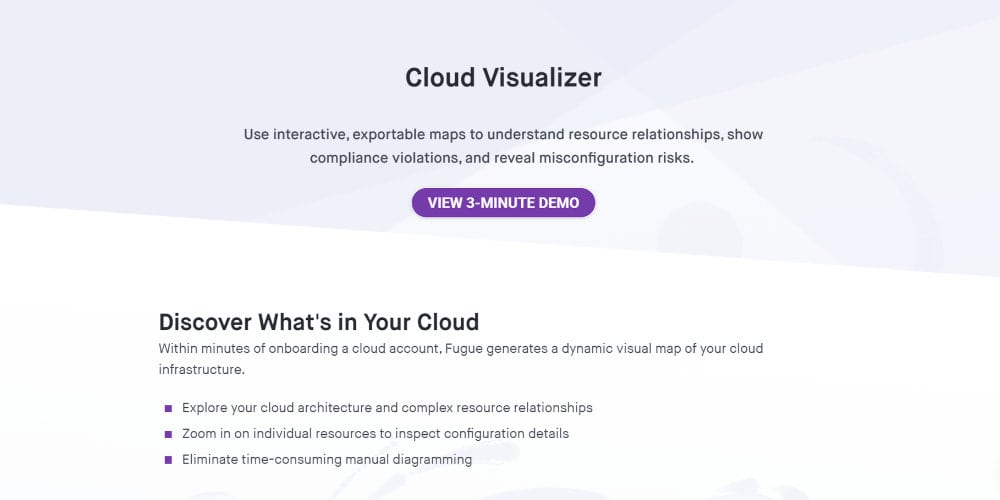
9) Fugue
Do you want to identify misconfiguration risks, investigate relationships between cloud resources, and learn about compliance violations? With Fugue’s dynamic, interactive, exportable, and visible cloud infrastructure map, you can find out what’s on your cloud.
You can get a complete grasp of the internal relationships between the components of AWS, Azure, and GCP’s cloud architectures by using this cloud visualization tool. Additionally, it enables thorough testing of each individual resource setup. Additionally, it enables you to eliminate the laborious manual diagramming process.
Automated maps and diagrams created by Fugue show your team, management and auditors how cloud compliance works. They also help you with historical snapshot analysis. As a result, you can see how your business’s compliance situation has changed over time.
Using automated visual data it is easy to uncover critical errors that could lead to misconfiguration concerns. Unexpected network connections and orphaned cloud resources are also exposed. Additionally, the platform enables visualization of compliance and violations according to your cloud architecture.
10) Cloudviz
Cloudviz is a great choice if you use Amazon Web Services and want to visualize its architecture with diagrams and documentation. Optimized security protocols are used to establish a connection with your cloud account.
Getting AWS architectural documents and diagrams is really easy once you’re connected. You can choose one of its templates to create documents based on your company’s design and other needs.
Updating diagrams is made easy by its diagram editing toolbar, which includes pre-existing official AWS icons, common shapes, and elements.
Cloudviz provides diagram generation profiles to meet diverse requirements for visualizing different cloud infrastructures. Users can customize the sketching parameters in addition to these profiles and later use them as their own profiles.
The following file types are available for exporting visualization data to Business: PNG, SVG, WORD, JSON, and PDF. It is also possible to move the properties of synchronized resources if needed.
You can schedule your documents and diagrams for an AWS environment with an automated profile. It is also possible to add diagrams created to various dashboards or wiki pages using this cloud visualization tool.
That’s it for the list of Cloud Visualization Tools.
ALSO SEE:
- Cloud Gaming Services
- Windows VPS Hosting
- Cloud Cost Management
- Discord Bot Hosting
- Jenkins Hosting Platforms
- Serverless Computing Platforms
Final Note
Cloud data visualization is becoming more and more important as more businesses opt for cloud solutions. Visualizing cloud data is easier with automated cloud visualization solutions than with manual methods.
Here, we discussed the best platforms for Cloud Visualization Tools. These solutions can be used by small and medium enterprises as well to enhance communication, streamline processes and increase company flexibility.